
How to use the map
EDITOR’S NOTE – This is the second in a series of articles explaining the latest updates to the HPWD interactive map – CEM.
By Jason Coleman, P.E, General Manager
The Aquifer Info tool is another new enhancement to the HPWD interactive map. When active, the border surrounding this link is a darker shade, and the text is highlighted. Once active, the user may click anywhere within the HPWD service area and obtain estimated aquifer information. If any aquifer unit is not present, there is a note that states “no value found”.
These parameters include:
• Saturated thickness of the Ogallala Aquifer
• 5-year water level change
• 10-year water level change
• Depth to base of the Ogallala Aquifer
• Depth to base of the Edwards-Trinity (High Plains) Aquifer (where present)
• Depth to base of the Upper Dockum Aquifer (where present)
• Depth to base of the Lower Dockum Aquifer
• Latitude of the specified location
• Longitude of the specified location
These items are listed in the top section of the pop-up (shown below) as tabular data.
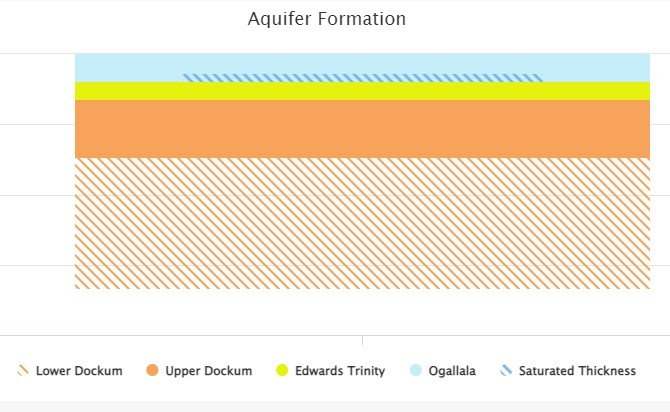
In the lower section of the pop-up window is a bar graph that illustrates these aquifer units. Using an appropriate scale, the thickness of each unit is represented by a unique color and pattern. The legend at the bottom serves as a guide to understanding the symbology. A sample of the bar chart and legend is shown in greater detail for your reference.

What is the source of data for the aquifer info? This is an excellent question, and we have listed the data source for each aquifer parameter here:
• Saturated thickness—HPWD calculates this value each year by subtracting the water table elevation from the base of aquifer elevation
• 5-year change—HPWD calculates the change in water levels each year, and is able to summarize any period of change. For this exercise, we use a 5-year interval.
• 10-year change—HPWD (see notes above)
• Ogallala base—this is actually a combination of data sources from HPWD’s older hydrologic atlases and newer data for some counties with limited data.
• Edwards-Trinity base—the High Plains Aquifer System (HPAS) Groundwater Availability Model (GAM)included a study of this aquifer unit, and we have taken that data and applied it to this tool.
• Upper Dockum—HPAS GAM (see notes above)
• Lower Dockum—HPAS GAM (see notes above)
In the next article, we will address the Legend feature of the HPWD interactive map.